
High Quality Calvert Equity
STRATEGY HIGHLIGHTS
We seek to invest in companies with a demonstrated history of consistent growth and stability in earnings in an effort to outperform over the long term by participating in rising markets and minimizing participation in declining markets. The strategy is managed with a fundamental, bottom up process, seeking to identify high quality growth businesses that operate in a manner consistent with the Principles for Responsible Investment of Calvert Research and Management.
Key Stats
| Asset Class: | Large Cap Equity |
| Primary Index: | Russell 1000® Growth |
| Inception Date: | October 1, 1998 |
| Strategy Assets: | $8.2 bn |
| Holdings Range: | 40 - 50 |
| Mkt. Cap at Purchase: | >$3 bn |
| Max Position Sizes: | 5% |
| Sector Constraint: | 30% |
| Max Cash: | 5% |
| 3-Yr Avg. Turnover: | 8% |
DOWNSIDE PARTICIPATION |
77%
Downside Capture
|
CALVERT ESG PARTNERSHIP |
25 Yrs
Track Record |
LOWER THAN MARKET VOLATILITY |
0.78
Beta Since Inception |
PERFORMANCE ANALYSIS
Investment Performance (%)
as of March 31, 2024
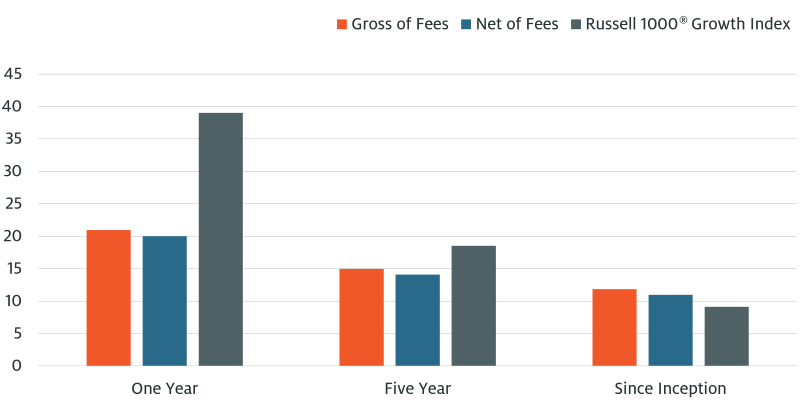
| Quarter | 1 Yr | 3 Yr | 5 Yr | 10 Yr | Since Inception | |
|---|---|---|---|---|---|---|
| High Quality Calvert Equity (Gross) | 5.81 | 20.93 | 9.95 | 14.97 | 14.59 | 11.84 |
| High Quality Calvert Equity (Net) | 5.60 | 19.99 | 9.08 | 14.07 | 13.69 | 10.95 |
| Russell 1000® Growth Index | 11.41 | 39.00 | 12.50 | 18.52 | 15.98 | 9.10 |
Periods greater than one year are annualized. Composite inception date 10/1/98. Composite data is based upon all discretionary institutional accounts eligible for inclusion in the Composite for the periods shown. Performance is calculated in US dollars and reflects the reinvestment of all income and capital gains. Net of fee returns reflect the deduction of the highest applicable annual management fee of 0.80%, applied monthly.
Up, Down, Cumulative Market Capture (%)
October 1, 1998 - March 31, 2024
Net of Fees
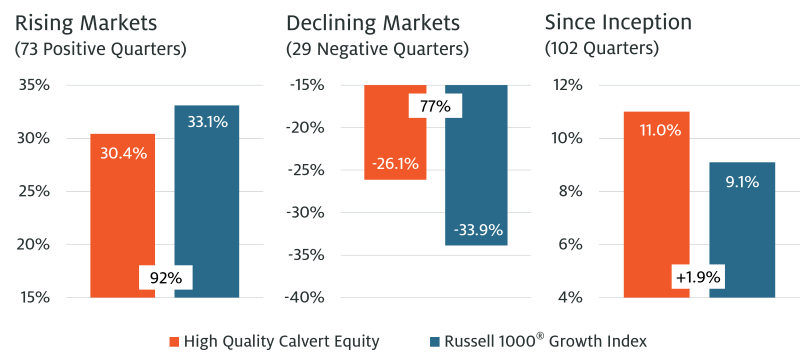
Annualized. Up-Down Market Capture measures composite performance (net of fees) relative to index during periods when index has risen / fallen. Source: eVestment.
PORTFOLIO CHARACTERISTICS
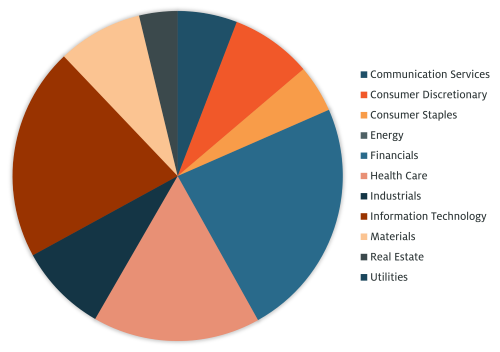
Sector Diversification (%)
as of March 31, 2024
| High Quality Calvert Equity | Russell 1000® Growth Index | Over/Under | |
|---|---|---|---|
| Communication Services | 5.8 | 12.0 | -6.2 |
| Consumer Discretionary | 8.0 | 14.9 | -6.9 |
| Consumer Staples | 4.7 | 4.1 | 0.6 |
| Energy | 0.0 | 0.5 | -0.5 |
| Financials | 23.5 | 6.4 | 17.1 |
| Health Care | 16.4 | 10.6 | 5.8 |
| Industrials | 8.7 | 5.8 | 2.9 |
| Information Technology | 20.9 | 44.0 | -23.1 |
| Materials | 8.3 | 0.7 | 7.6 |
| Real Estate | 3.8 | 0.8 | 3.0 |
| Utilities | 0.0 | 0.1 | -0.1 |
Sector Diversification and Top Ten Holdings are based on the equity-only assets of a representative client portfolio managed according to this strategy. Sources: Atlanta Capital, eVestment, FactSet.
Sector Diversification (%)
as of March 31, 2024
Top Ten Holdings
(%) of representative portfolio
| Mastercard CL A | 5.0 |
| Microsoft Corporation | 4.9 |
| Alphabet CL C | 4.9 |
| Thermo Fisher Scientific | 4.8 |
| Visa CL A | 4.8 |
| Danaher Corporation | 4.7 |
| TJX Companies | 3.7 |
| Zoetis CL A | 3.6 |
| Gartner | 3.4 |
| Intuit | 3.3 |
| TOTAL | 43.1% |


Risk Considerations:
Equity: The value of investments held by the Strategy may increase or decrease in response to economic, and financial events (whether real, expected or perceived) in the U.S. and global markets. The value of equity securities is sensitive to stock market volatility.
The views and opinions are those of the author as of the date of publication and are subject to change at any time due to market or economic conditions and may not necessarily come to pass. The views expressed do not reflect the opinions of all investment personnel at Morgan Stanley Investment Management (MSIM) and its subsidiaries and affiliates (collectively the Firm”), and may not be reflected in all the strategies and products that the Firm offers.
This material is for the benefit of persons whom the Firm reasonably believes it is permitted to communicate to and should not be forwarded to any other person without the consent of the Firm. It is not addressed to any other person and may not be used by them for any purpose whatsoever. It expresses no views as to the suitability of the investments described herein to the individual circumstances of any recipient or otherwise. It is the responsibility of every person reading this material to fully observe the laws of any relevant country, including obtaining any governmental or other consent which may be required or observing any other formality which needs to be observed in that country. Unless otherwise stated, returns and market values contained herein are presented in U.S. dollars.
This material is a general communication, which is not impartial, is for informational and educational purposes only, not a recommendation to purchase or sell specific securities, or to adopt any particular investment strategy. Information does not address financial objectives, situation or specific needs of individual investors.
Any charts and graphs provided are for illustrative purposes only. Any performance quoted represents past performance. Past performance does not guarantee future results. All investments involve risks, including the possible loss of principal.
Prior to making any investment decision, investors should carefully review the strategy’s relevant offering document. For the complete content and important disclosures, refer to the GIPS Disclosure link on this page.
© 2024 Morgan Stanley. All rights reserved.
